Key Financial Figures:
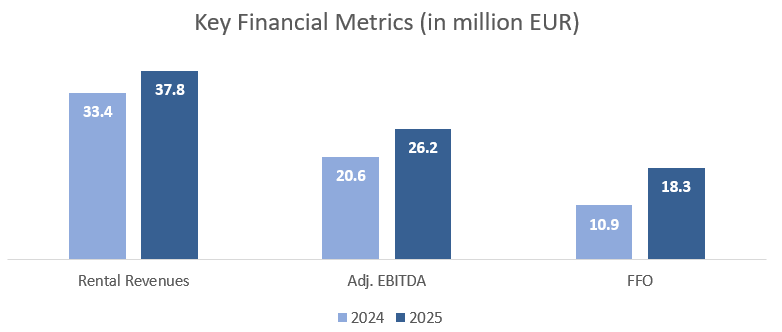
- Rental revenues from investment properties of EUR 37.8 million, increased by EUR 4.4 million (increase 13%) compared to 2024
- Adjusted-EBITDA (a-EBITDA) EUR 26.2 million increased by EUR 5.6 million (increase 27%) compared to 2024
- Fair value of investment portfolio[1] reached EUR 693.6 million as of 31.12.2025, increased by EUR 45.3 million (increase 7%) compared to 31 December 2024
- The net asset value (NAV) as of 31.12.2025 amounted to EUR 554.9 million (EUR 4.39 per share), increased by EUR 35.8 million (increase 7%) compared to 31 December 2024
Commenting on the Company’s performance, Georgios Koutsopodiotis, Noval Property’s Chief Executive Officer, stated:
“The execution and completion of part of Noval Property’s investment program continued successfully, with two additional assets delivered in 2025: the mixed‑use building ‘Ardittos House’ in Mets and the prime office building on Chimarras Street in Marousi. At the same time, the Company’s commitment to reshaping the urban landscape through modern and sustainable projects was reaffirmed by the attainment of LEED Gold certification for these buildings.
Active asset management and the high quality of the income‑producing portfolio, combined with the development of new environmentally certified buildings, contributed to the improvement of the Company’s operating profitability and the further strengthening of its Net Asset Value (NAV), which reached €555 million. In parallel, the Gross Asset Value (GAV) of the investment portfolio amounted to €694 million.
These results reaffirm the consistency and effectiveness with which we execute the Company’s strategy, accelerating the formation of a modern and resilient portfolio.
Key priority for the period ahead is the completion of the major project of the joint venture The Grid SA, as well as the development of the portfolio through the upgrading and repositioning of existing properties, creating long‑term value for all stakeholders through new targeted investments and the effective management of the Company’s existing real estate assets.”
Overview
Rental revenues for the year ending 31 December 2025 amounted to EUR 37.8 million, compared to EUR 33.4 million for the financial year 2024, demonstrating an increase of EUR 4.4 million (increase 13%). The rental revenue increase is due to the active asset management of the Company’s properties, which, combined with the high quality of our properties, led to the signing of new lease agreements and to the replacement of existing lease agreements with new ones under more favorable terms. At the same time, the increase in tenants’ turnover contributed to the strengthening of the turnover rent revenues.
During 2025, the Company delivered two new assets to the market. The mixed‑use building “Ardittos House” in Mets, Athens which includes luxury residences and modern office spaces, was completed in the first half of the year, reaching an occupancy rate of approximately 60% as of 31 December 2025. In the second half of the year, the prime office building on Chimarras Street in Marousi was also completed, with the property being fully leased as of 31 December 2025.
In addition, in February 2026, the Company completed the reconstruction of the existing office building at 199 Kifisias Avenue in Marousi which was delivered for use to a tenant. In addition, significant progress has been made in the construction works for the development of a new six‑storey office complex in Marousi, owned by the joint venture The Grid SA, with a total built area of approximately 62,000 sq.m. and an expected LEED Platinum certification.
Adjusted EBITDA for the 2025 financial year amounted to €26.2 million, compared to €20.6 million in 2024, representing an increase of €5.6 million (up 27%). This performance was driven by the significant rise in rental income and the strengthening of operational efficiency.
Funds from Operations as of 31 December 2025 amounted to EUR 18.3 million, compared to EUR 10.9 million in 2024. This significant increase of €7.5 million, or 68%, stems from the aforementioned improvements in rental income and operational efficiency, as well as from the reduction in ECB interest rates, which lowered interest expenses, and from the decrease in the wealth tax burden.
The fair value of Noval Property’s investment portfolio as of 31 December 2025 amounted to EUR 693.6 million, compared to EUR 648.3 million on 31 December 2024, registering an increase of EUR 45.3 million (increase 7%). The increase in the fair value of the investment portfolio is driven by active asset management and the quality of the Company’s income generating properties, as well as by the construction progress of the properties under development.
Cash and cash equivalents amounted to EUR 47.6 million, compared to EUR 72.8 as of 31 December 2024.
The net asset value (NAV) as of 31 December 2025 amounted to EUR 554.9 million (EUR 4.39 per share) compared to EUR 519.1 million as of 31 December 2024, marking an increase of EUR 35.8 million (increase 7%).
Noval Property’s Board of Directors, during the meeting that took place on 2 March 2026, resolved in favor of proposing to the Annual Ordinary Shareholder’s Meeting a dividend distribution EUR 0.07 per share for the fiscal year ending on 31 December 2025, representing an increase of EUR 0.027 per share compared to the dividend distribution for the fiscal year ended 31 December 2024 (increase 63%).
Disclaimer: This document presents the financial results and key financial information of Noval Property for the fiscal year ended on December 31, 2025, and has been prepared, in all material respects, in accordance with International Financial Reporting Standards. All figures, data, and information included in this document refer to unaudited financial figures and include estimates from the Company’s management and forecasts concerning financial data or other events of the financial year 2025. In the period leading up to the publication of Noval Property’s audited Annual Financial Report for the year ended on December 31, 2025, which is scheduled for March 30, 2026, should any events occur, that would significantly affect the figures, data, and information presented herein, the Company will promptly inform the investment community.
The Annual Financial Report and the Investment Schedule of Noval Property as of 31 December 2025 will be available on the Company’s website www.noval-property.com on March 30th, 2026.
Contact:
For more information please contact:
Georgios Karachalios
Investor Relations & Finance Manager
Email: gkarachalios@noval-property.com
Tel. +30 216 8619216
EXHIBIT Α – STATEMENT OF FINANCIAL POSITION*
| Amounts in € ’000s | 31.12.2025 | 31.12.2024 |
| Assets | ||
| Non-current assets | ||
| Investment property | 657.588 | 616.703 |
| Property and equipment | 7.177 | 799 |
| Rights of use | 425 | 2.773 |
| Intangible assets | 89 | 146 |
| Participations | 32.398 | 31.063 |
| Shareholders’ loan to JV | 10.395 | 9.586 |
| Derivatives | 1.021 | 1.094 |
| Other long-term assets | 3.750 | 3.891 |
| Total Non-current assets | 712.843 | 666.054 |
| Current assets | ||
| Trade and other assets | 6.579 | 7.024 |
| Derivatives | 270 | 364 |
| Cash and cash equivalents | 47.648 | 72.789 |
| Total Current assets | 54.497 | 80.177 |
| Total assets | 767.341 | 746.231 |
| Equity | ||
| Share capital | 316.080 | 316.080 |
| Share Premium | 6.643 | 6.643 |
| Statutory Reserve | 2.050 | 0 |
| Treasury shares | (671) | 0 |
| Reserves | 1.989 | 1.075 |
| Retained earnings | 228.809 | 195.302 |
| Total equity | 554.899 | 519.099 |
| Liabilities | ||
| Long – term liabilities | ||
| Borrowings | 180.281 | 184.420 |
| Lease liabilities | 13.750 | 13.871 |
| Retirement benefit obligations | 77 | 78 |
| Other Non-current liabilities | 2.844 | 2.758 |
| Total Long – term liabilities | 196.952 | 201.127 |
| Short – term liabilities | ||
| Borrowings | 7.353 | 11.506 |
| Trade and other payables | 6.479 | 12.340 |
| Current tax liabilities | 1.175 | 1.725 |
| Lease liabilities | 483 | 434 |
| Total Short – term liabilities | 15.490 | 26.005 |
| Total liabilities | 212.442 | 227.132 |
| Total equity and liabilities | 767.341 | 746.231 |
* The amounts presented in this Press Release are rounded and any deviation of the respective amounts in the financial statements are due to rounding.
EXHIBIT Β – STATEMENT OF COMPEHENSIVE INCOME*
| Amounts in € ’000s | 01.01 –
31.12.2025 |
01.01 –
31.12.2024 |
| Revenue | 37.788 | 33.417 |
| Net gain / (loss) from fair value adjustment of investment property | 20.188 | 24.497 |
| Direct property related expenses | (1.908) | (2.884) |
| Property taxes – levies | (3.212) | (2.904) |
| Personnel expenses | (4.318) | (5.351) |
| Other operating expenses | (2.127) | (2.198) |
| Net Impairment loss on financial assets | (300) | (221) |
| Gains / (losses) from the derecognition of financial assets measured at amortized cost | (89) | 0 |
| Gain/(Loss) from property sale | 0 | 6 |
| Depreciation of property and equipment | (430) | (389) |
| Other income | 219 | 714 |
| Operating profit | 45.811 | 44.686 |
| Interest income | 3.008 | 5.906 |
| Finance costs | (6.659) | (8.315) |
| Portion of gain / (loss) from participation in joint ventures | 1.335 | 8.561 |
| Profit before tax | 43.494 | 50.837 |
| Taxes | (2.501) | (3.573) |
| Profit after tax | 40.993 | 47.264 |
| Other comprehensive income | ||
| Items that will not be reclassified to profit or loss | ||
| Actuarial gains | 1 | 18 |
| Total | 1 | 18 |
| Items that may be reclassified to profit or loss | ||
| Revaluation of fixed assets to fair value | 1.081 | 0 |
| Gain / (loss) from valuation of cash flow hedging – effective | 195 | 151 |
| (Gain) / loss from valuation of cash flow hedging – transfer to profit and loss | (362) | (664) |
| Total | 914 | (513) |
| Other comprehensive income | 915 | (495) |
| Total comprehensive income | 41.908 | 46.769 |
* The amounts presented in this Press Release are rounded and any deviation of the respective amounts in the financial statements are due to rounding.
EXHIBIT C – PERFOMANCE MEASURES*
| a-EBITDA | ||
| (amounts in ‘000 €) | 01.01-31.12.2025 | 01.01-31.12.2024 |
| Profit / (Loss) before tax | 43.494 | 50.837 |
| Plus / (Less): Loss / (Profit) from investment property fair value adjustment | (20.188) | (24.497) |
| Plus: Depreciation | 430 | 389 |
| Less: Financial Income | (3.008) | (5.906) |
| Plus: Financial Expenses | 6.659 | 8.315 |
| Plus / (Less): Share of loss / (profit) from participations in joint ventures | (1.335) | (8.561) |
| Plus / (Less): Net non-recurring expenses/ (income) | (176) | (217) |
| Plus / (Less): Net impairment loss of financial assets | 300 | 221 |
| a-EBITDA | 26.177 | 20.582 |
| Funds from Operations (FFO) | ||
| (amounts in ‘000 €) | 01.01-31.12.2025 | 01.01-31.12.2024 |
| Profit / (Loss) after tax | 40.993 | 47.264 |
| Plus: Depreciation | 430 | 389 |
| Plus / (Less): Share of loss / (profit) from participations in joint ventures | (1.335) | (8.561) |
| Plus / (Less): Loss / (Profit) from investment property fair value adjustment | (20.188) | (24.497) |
| Plus / (Less): Loss/(Profit) from sale of investment properties | 0 | (6) |
| Plus / (Less): Net loss/ (gain) from modification of terms of loan agreements | (710) | (2.727) |
| Less: Capitalization of interest | (877) | (947) |
| Plus / (Less): Net impairment loss of financial assets | 300 | 221 |
| Plus / (Less): Adjustments for non-cash and non-recurring items | (275) | (253) |
| FFO | 18.338 | 10.884 |
* The amounts presented in this Press Release are rounded and any deviation of the respective amounts in the financial statements are due to rounding.
[1] The Fair Value of the investment portfolio, as per Investment Schedule, includes loan and participation in a real estate company