Key Financial Figures:
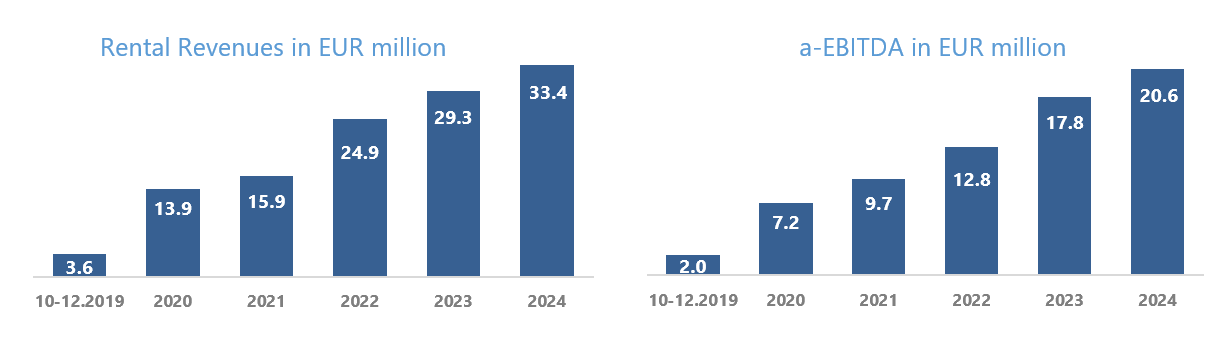
- Rental revenues from investment properties of EUR 33.4 million, increased by EUR 4.1 million (increase 14%) compared to 2023
- Adjusted-EBITDA (a-EBITDA) EUR 20.6 million increased by EUR 2.8 million (increase 16%) compared to 2023
- Fair value of investment portfolio1 reached EUR 648.3 million as of 31.12.2024, increased by EUR 77.1 million (increase 13%) compared to 31 December 2023
- The net asset value (NAV) as of 31.12.2024 amounted to EUR 519.1 million (EUR 4.11 per share), increased by EUR 91.7 million (increase 21%) compared to 31 December 2023
Commenting on the Company’s performance, Mihalis Panagis, Noval Property’s Chief Executive Officer, stated:
“2024 was an important year for Noval Property, as the Company listed its shares on the Athens Stock Exchange and raised significant funds to implement its investment strategy, focusing on strengthening further its modern, high-quality and diversified real estate portfolio. In 2024, active asset management and the quality of the income producing portfolio, along with the development of sustainable and environmentally certified buildings, led to an increase of 16% in operational profitability and a 21% increase in net asset value (NAV) when compared to 2023.
The strong performance and the achievement of the Company’s targets during the past year are the result of the successful execution of our investment program, aligned with our growth strategy.
The main priorities for 2025 are to complete the ongoing developments, upgrade, reposition and develop existing properties, while further enhancing our portfolio through the acquisition of new assets. Our primary goal is to generate long-term value for our shareholders and all stakeholders of the Company”.
_____________________
- The Fair Value of the investment portfolio, as per Investment Schedule, includes loan and participation in a real estate company
Overview
Rental revenues for the year ending 31 December 2024 amounted to EUR 33.4 million, compared to EUR 29.3 million for the financial year 2023, demonstrating an increase of EUR 4.1 million (increase 14%). The rental revenue increase is due to the active asset management of the Company’s properties, which, combined with the high quality of our properties, led to the signing of new lease agreements and to the replacement of existing lease agreements with new ones under more favorable terms. It also contributed to stronger tenant sales turnover at our retail properties, part of which is paid to the Company as turnover rent.
During the first quarter of 2024, the new logistics centre in Mandra, Attica, which is LEED Gold certified, was delivered to its tenant. Furthermore, the Company leased approximately 30% of the residential part of the mixed-use property located on 40-42 Ardittou Street in Athens. Additionally, significant progress has been made in the construction of the new office building on Chimarras Street in Marousi, which is expected to be delivered in the first half of 2025, as well as the redevelopment of an existing office building on 199 Kifisias Avenue in Marousi, which is anticipated to be delivered in the last quarter of 2025.
In 2024, The Grid S.A., a joint venture between Noval Property and Brook Lane Capital, signed a lease agreement with EY Greece for office space in two of the four buildings of the ‘The Grid’ office campus under construction, in Marousi.
Earnings before interest, tax, depreciation, amortization, and profit from fair value adjustment (adjusted EBITDA) for 2024 amounted to EUR 20.6 million, compared to EUR 17.8 million in 2023, demonstrating an increase of EUR 2.8 million (increase 16%) and demonstrating a significant improvement of the Company’s overall operational efficiency.
Funds from Operations2 as of 31 December 2024 amounted to EUR 10.9 million, compared to EUR 6.3 million in 2023 (excludes interest income), increased by EUR 2.6 million (increase 31%) on a comparable basis, as a result of the above actions of the Company.
The fair value of Noval Property’s investment portfolio1 as of 31 December 2024 amounted to EUR 648.3 million, compared to EUR 571.2 million in 2023, registering an increase of EUR 77.1 million (increase 13%). The increase in the fair value of the investment portfolio is driven by the active asset management and the quality of the Company’s income generating properties, as well as by the construction progress of the properties under development.
Cash and cash equivalents amounted to EUR 72.8 million, compared to EUR 74.6 as at 31 December 2023.
The net asset value (NAV) as of 31 December 2024 amounted to EUR 519.1 million (EUR 4,11 per share) compared to EUR 427.4 million as at 31 December 2023, representing an increase of EUR 91.7 million, (increase 21%).
Noval Property’s Board of Directors, during the meeting that took place on 27 February 2025, resolved in favor of proposing to the Annual Ordinary Shareholder’s Meeting a dividend distribution EUR 0,043 per share for the fiscal year ending on 31 December 2024, representing an increase of EUR 0,018 per share compared to the dividend distribution for the fiscal year ended 31 December 2023 (increase 72%).
_____________________
- The Fair Value of the investment portfolio, as per Investment Schedule, includes loan and participation in a real estate company
- Starting with the fiscal year 2024, the Company has elected to include interest income earned on deposits in the calculation of Funds from Operations in line with general practices applied in the sector it operates. The amount for the period ending 31 December 2024 is at EUR 2.2 million (2023: EUR 2.0 million)
Disclaimer: This document presents the financial results and key financial information of Noval Property for the fiscal year ended on December 31, 2024, and has been prepared, in all material respects, in accordance with International Financial Reporting Standards. All figures, data, and information included in this document refer to unaudited financial figures and include estimates from the Company’s management and forecasts concerning financial data or other events of the financial year 2024. In the period leading up to the publication of Noval Property’s audited Annual Financial Report for the year ended on December 31, 2024, which is scheduled for March 27, 2025, should any events occur, that would significantly affect the figures, data, and information presented herein, the Company will promptly inform the investment community.
Noval Property, pursuant to Hellenic Capital Market Commission’s decision no. 8/259/19-12-2002, as amended and currently in force, publishes the Company’s Investment Schedule dated 31st December 2024, which has been posted on the company’s website www.noval-property.com
The Annual Financial Report of Noval Property as of 31 December 2024 will be available on the Company’s website www.noval-property.com
About Noval Property
Noval Property is a Real Estate Investment Company (REIC), listed on the Athens Stock Exchange. The investment portfolio of Noval Property, which comprises 61 properties (1 through a participation in a real estate company) located mostly in Greece and selectively in Bulgaria, includes office buildings, shopping centres, retail parks, logistics, residential, hospitality and industrial assets of total leasable area of approx. 343.000 sq.m.. The fair value of Noval Property’s investment portfolio reached EUR 648 million as of 31st December 2024. Noval Property is a subsidiary of Viohalco in the real estate sector.
For more information, you may visit our web site www.noval-property.com.
EXHIBIT Α – STATEMENT OF FINANCIAL POSITION*
| Amounts in € ’000s | 31.12.2024 | 31.12.2023 |
| Assets | ||
| Non-current assets | ||
| Investment property | 616.703 | 557.312 |
| Property and equipment | 799 | 835 |
| Rights of use | 2.773 | 2.751 |
| Intangible assets | 146 | 181 |
| Participations | 31.063 | 22.503 |
| Shareholders’ loan to JV | 9.586 | – |
| Derivatives | 1.094 | 1.366 |
| Other long-term assets | 3.891 | 2.356 |
| Total Non-current assets | 666.054 | 587.304 |
| Current assets | ||
| Trade and other assets | 7.024 | 7.752 |
| Derivatives | 364 | 605 |
| Cash and cash equivalents | 72.789 | 74.578 |
| Total Current assets | 80.177 | 82.935 |
| Total assets | 746.231 | 670.239 |
| Equity | ||
| Share capital | 316.080 | 268.668 |
| Share Premium | 6.643 | 5.956 |
| Reserves | 1.075 | 1.588 |
| Retained earnings | 195.302 | 151.178 |
| Total equity | 519.099 | 427.390 |
| Liabilities | ||
| Long – term liabilities | ||
| Borrowings | 184.420 | 203.467 |
| Lease liabilities | 13.871 | 13.314 |
| Retirement benefit obligations | 78 | 73 |
| Other Non-current liabilities | 2.758 | – |
| Total Long – term liabilities | 201.127 | 216.854 |
| Short – term liabilities | ||
| Borrowings | 11.506 | 11.167 |
| Trade and other payables | 12.340 | 12.816 |
| Current tax liabilities | 1.725 | 1.662 |
| Lease liabilities | 434 | 350 |
| Total Short – term liabilities | 26.005 | 25.995 |
| Total liabilities | 227.132 | 242.849 |
| Total equity and liabilities | 746.231 | 670.239 |
* The amounts presented in this Press Release are rounded and any deviation of the respective amounts in the financial statements are due to rounding.
EXHIBIT Β – STATEMENT OF COMPEHENSIVE INCOME*
| Amounts in € ’000s |
01.01 – 31.12.2024 |
01.01 – 31.12.2023 |
| Revenue | 33.417 | 29.339 |
| Net gain / (loss) from fair value adjustment of investment property | 24.497 | 47.640 |
| Direct property related expenses | (2.884) | (3.062) |
| Property taxes – levies | (2.904) | (2.787) |
| Personnel expenses | (5.351) | (3.915) |
| Other operating expenses | (2.198) | (2.469) |
| Net Impairment loss on financial assets | (221) | (98) |
| Gain/(Loss) from property sale | 6 | (3) |
| Depreciation of property and equipment | (389) | (238) |
| Other income | 714 | 716 |
| Operating profit | 44.686 | 65.123 |
| Interest income | 5.906 | 2.015 |
| Finance costs | (8.315) | (8.518) |
| Portion of gain/(loss) from participation in joint ventures | 8.561 | 8.840 |
| Profit before tax | 50.837 | 67.460 |
| Taxes | (3.573) | (2.853) |
| Profit after tax | 47.264 | 64.607 |
| Other comprehensive income | ||
| Items that will not be reclassified to profit or loss | ||
| Actuarial gains | 18 | 5 |
| Total | 18 | 5 |
| Items that may be reclassified to profit or loss | ||
| Gain / (loss) from valuation of cash flow hedging – effective | 151 | (396) |
| (Gain) / loss from valuation of cash flow hedging – transfer to profit and loss | (664) | (493) |
| Total | (513) | (889) |
| Other comprehensive income | (495) | (884) |
| Total comprehensive income | 46.769 | 63.723 |
* The amounts presented in this Press Release are rounded and any deviation of the respective amounts in the financial statements are due to rounding.
EXHIBIT C – PERFOMANCE MEASURES*
| a-EBITDA | ||
| (amounts in ‘000 €) | 01.01-31.12.2024 | 01.01-31.12.2023 |
| Profit / (Loss) before tax | 50.837 | 67.460 |
| Plus / (Less): Loss / (Profit) from investment property fair value adjustment | (24.497) | (47.640) |
| Plus: Depreciation | 389 | 238 |
| Less: Financial Income | (2.966) | (2.015) |
| Plus / (Less): Loss/ (gain) from modification of terms of loan agreements | (2.727) | – |
| Plus: Financial Expenses | 8.103 | 8.518 |
| Plus / (Less): Share of loss / (profit) from participations in joint ventures | (8.561) | (8.840) |
| Plus / (Less): Net non-recurring expenses/ (income) | (217) | – |
| Plus / (Less): Net impairment loss of financial assets | 221 | 98 |
| a-EBITDA | 20.582 | 17.819 |
| Funds from Operations (FFO) | ||
| (amounts in ‘000 €) | 01.01-31.12.2024 | 01.01-31.12.2023 |
| Profit / (Loss) after tax | 47.264 | 64.607 |
| Plus: Depreciation | 389 | 238 |
| Plus / (Less): Share of loss / (profit) from participations in joint ventures | (8.561) | (8.840) |
| Plus / (Less): Loss / (Profit) from investment property fair value adjustment | (24.497) | (47.640) |
| Plus / (Less): Loss/(Profit) from sale of investment properties | (6) | 3 |
| Plus / (Less): Financial Income2 | – | (2.015) |
| Plus / (Less): Net loss/ (gain) from modification of terms of loan agreements | (2.727) | – |
| Less: Capitalization of interest | (947) | (482) |
| Plus / (Less): Net impairment loss of financial assets | 221 | 98 |
| Plus / (Less): Adjustments for non-cash and non-recurring items | (253) | 347 |
| FFO | 10.884 | 6.316 |
* The amounts presented in this Press Release are rounded and any deviation of the respective amounts in the financial statements are due to rounding.